A lire sur: http://www.asymco.com/2013/10/07/when-will-the-us-reach-smartphone-saturation/
I set the time frame for the graph to start in 2005 because there was still a market at the time. We can estimate the number of users from data supplied by RIM. They had about 2 million subs in 2005, the majority of whom were in the US.
Given these data points we can draw a new penetration graph extrapolating to the complete date range.
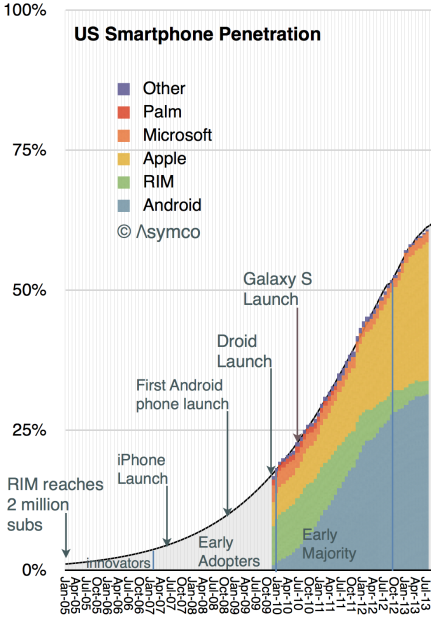
I added a few events that mark some of the product launched during this period.
The penetration curve shown happens to be defined as the “Logistic Function” whose equation is well known:
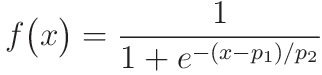
p1 is the number of periods (in months) that it took for the market to reach 50% penetration and p2 is an index of which can be adjusted for this market.
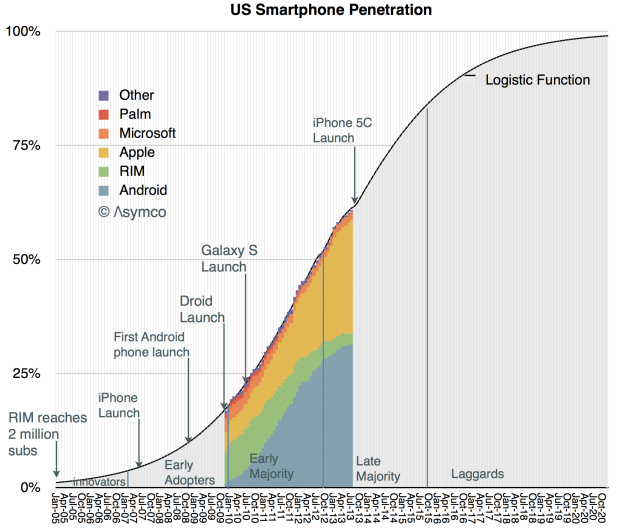
Note that I also identified successive groups of consumers adopting smartphones as defined by Rogers in his Diffusion of Innovations. This is easily done since the formula for penetration gives us the answer (as the integral):
The laggards will adopt smartphones from late 2015 until late 2020.
As this is the diffusion curve for the US, most other large regions are going to be shifted to the right and the global total can probably be estimated.
What remains to be done is to estimate the way the platform colors will fill in over this time frame for the US and to do the same analysis on a global level.
Oct 7, ’13
7:28 PM
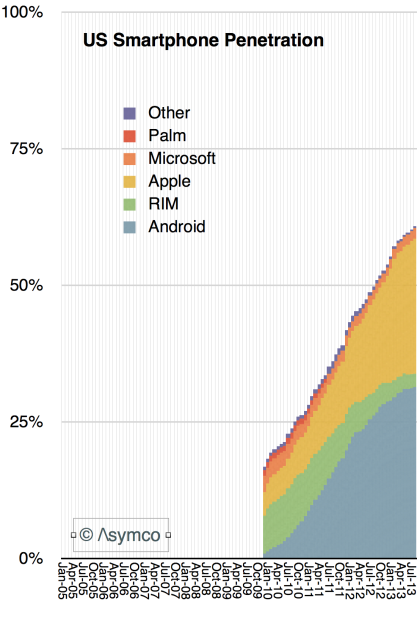
The latest comScore data places penetration at about 61%, up over
10 percentage points from the same time last year. The 50% last year is
itself up nearly 14 percentage points from the same time in 2011. This
progress in the diffusion of smartphones is shown the following graph: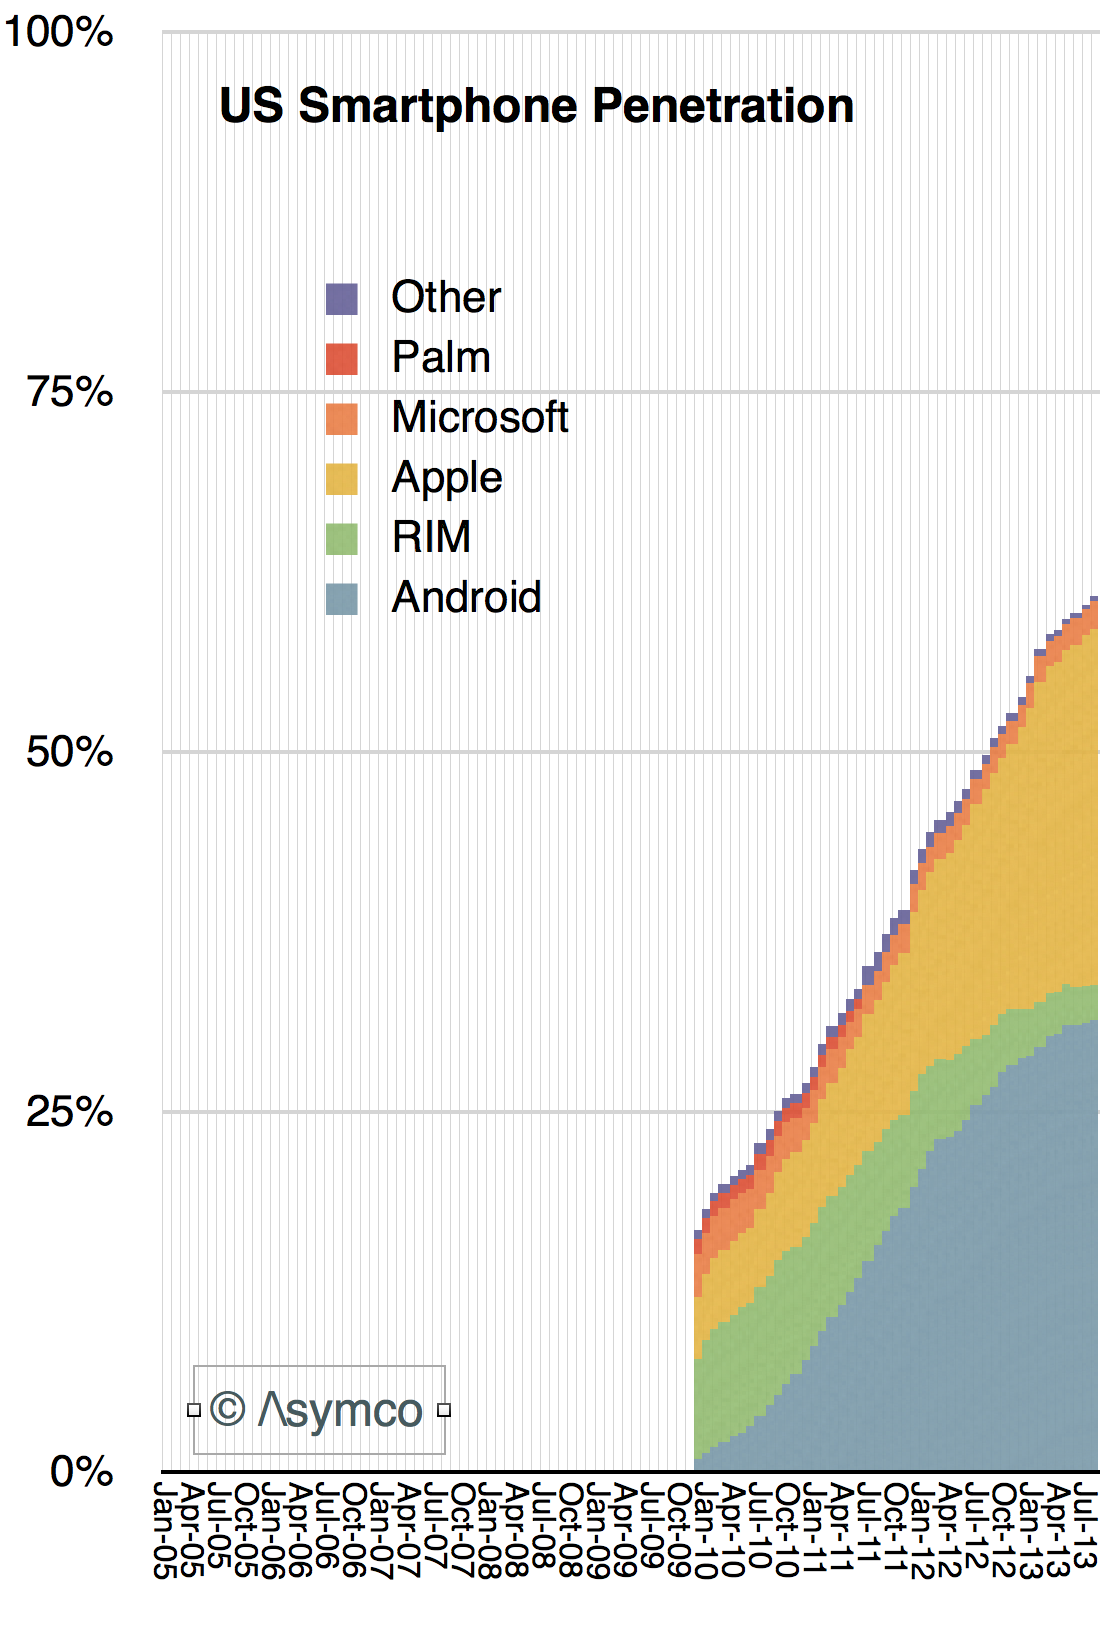
I set the time frame for the graph to start in 2005 because there was still a market at the time. We can estimate the number of users from data supplied by RIM. They had about 2 million subs in 2005, the majority of whom were in the US.
Given these data points we can draw a new penetration graph extrapolating to the complete date range.

I added a few events that mark some of the product launched during this period.
The penetration curve shown happens to be defined as the “Logistic Function” whose equation is well known:
p1 is the number of periods (in months) that it took for the market to reach 50% penetration and p2 is an index of which can be adjusted for this market.
Note that I also identified successive groups of consumers adopting smartphones as defined by Rogers in his Diffusion of Innovations. This is easily done since the formula for penetration gives us the answer (as the integral):
- The Innovators (first 2.5% of the market) were recruited by February 2007, one month after the iPhone was announced. They were almost all BlackBerry users
- The Early Adopters (the 13.5% which followed the innovators) were all using smartphones by the beginning of 2010. They were served mainly by iPhone 3GS and BlackBerries
- The Early Majority were on board by October 2012, just in time for iPhone 4, Droid, Galaxy.
- We are now in the Late majority which will run out by November 2015. The iPhone 5S came out about one third of the way through this period.

The laggards will adopt smartphones from late 2015 until late 2020.
As this is the diffusion curve for the US, most other large regions are going to be shifted to the right and the global total can probably be estimated.
What remains to be done is to estimate the way the platform colors will fill in over this time frame for the US and to do the same analysis on a global level.
Aucun commentaire:
Enregistrer un commentaire